Skip to content

Category: bigquery

Data Mesh implementation with GCP BigQuery

In today’s data-driven landscape, organizations often have multiple teams comprising domain experts who create their own unique products. However, enabling other teams to leverage these products efficiently requires a structured approach. Enter data mesh—a paradigm that decentralizes data ownership and processing. In this guide, we’ll explore how to implement data mesh using Google Cloud Platform (GCP) BigQuery, empowering teams to manage their data products seamlessly.

Setting up Domain-Specific GCP Projects

Begin by assigning a dedicated GCP project to each domain or business team. This ensures that teams have the autonomy to develop and manage their data products within their respective environments. By segregating projects based on domains, teams can focus on their specific requirements without interfering with others’ workflows.

Development and Promotion Workflow

Within their assigned GCP projects, domain teams develop their data products tailored to their expertise. These products undergo rigorous testing and refinement in the development environment. However, it’s crucial to avoid publishing directly from the development environment to prevent potential disruptions for subscribers. Frequent changes in the development phase can lead to compatibility issues and operational challenges for downstream users.

Promotion to Higher Environments

Once a data product is deemed ready for consumption, it’s promoted to higher environments, typically housed in different GCP projects. This transition ensures that only validated and stable versions of products are made available to subscribers. By segregating development and production environments, organizations can maintain data integrity and stability while minimizing disruptions to subscriber workflows.

Publishing Data Products

When promoting a data product to a higher environment, a team lead assumes the responsibility of publishing it. This involves orchestrating a seamless transition and ensuring that subscribers can access the updated version without interruptions.

Make sure Analytics Hub API is enabled for this.

Follow these steps to publish your product:

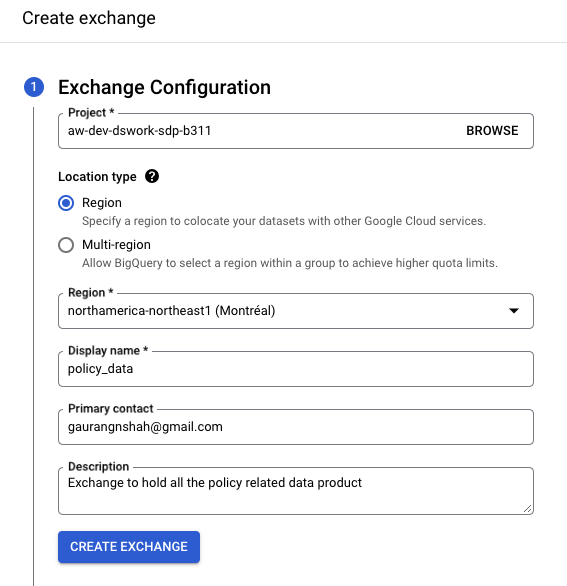
  1. Navigate to GCP BigQuery and access Analytics Hub. Click on “Create Exchange.”
  2. Depending on the nature of your product, provide the necessary details and proceed by clicking “Create Exchange.”
    create exchange to hold data products in GCP bigquery Analytics Hub
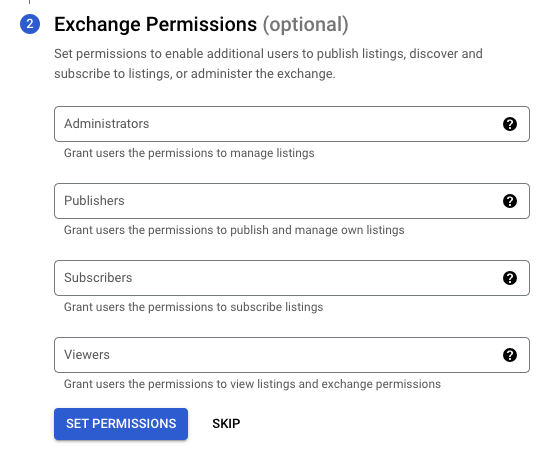
  3. At this stage, you’ll have the option to configure permissions for administration, publishing, subscription, and viewing of the listing. You can either set these permissions now or configure them later.
    GCP Bigquery Analytics Hub Exchange Permission setting
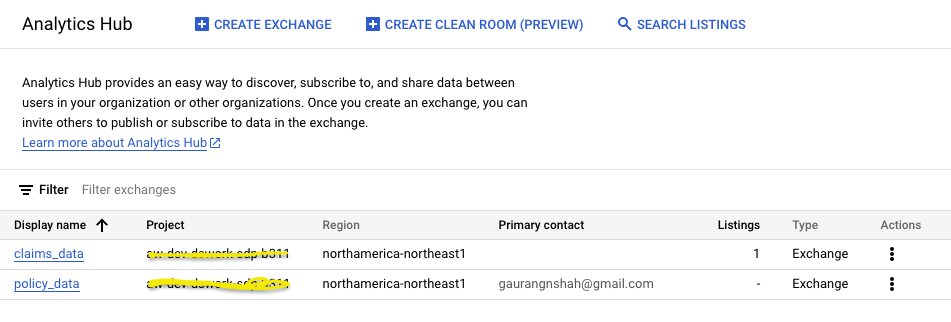
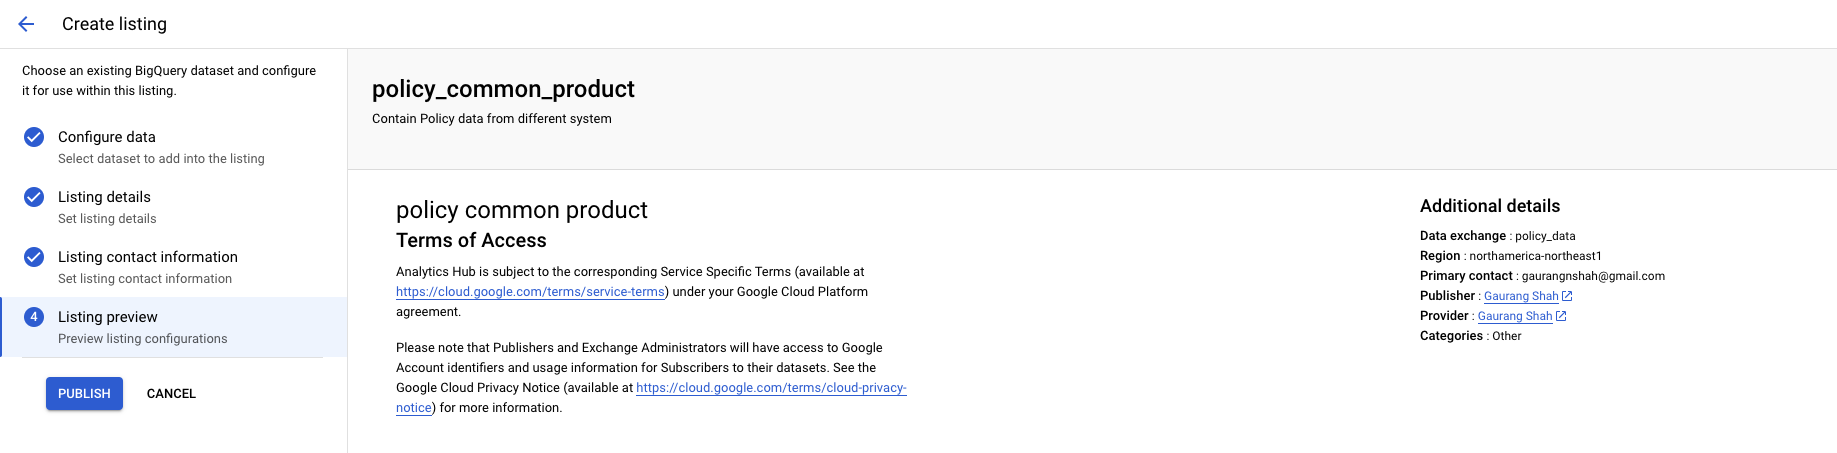
  4. Once the exchange is created, proceed to create a listing for it. A listing involves selecting the dataset you wish to publish. Currently, GCP BigQuery only allows choosing datasets only. And depends on what location you choose for your exchange you should be able to select datasets.
    GCP bigquery Analytics hub listing.
  5. Provide the required Listing Details and Listing Contact Information corresponding to your data product. Once completed, you’ll be able to publish the dataset through the listing.

    Listing ready to publishImplement data mesh using GCP BigQuery Analytics Hub

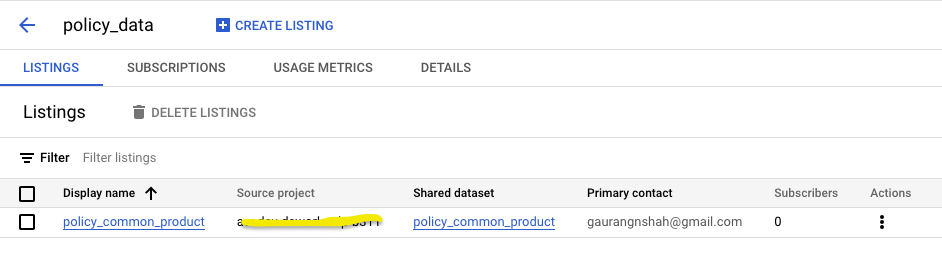
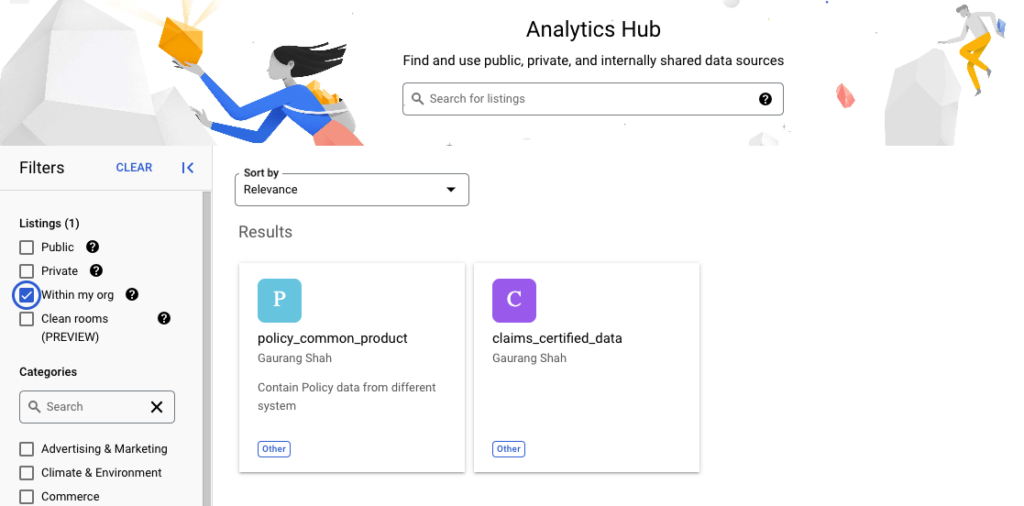
Subscribing to the Data Products (listings)

  • Once the Data Product is published other users can search and subscribe to this listing. User would need access to create a new Dataset in the project they want to subscribe this new data products.

Leave a Comment

GCP Bigquery – Find Partition column for each table

What Are Partition Columns?

In BigQuery, tables can be partitioned based on particular column. Partitioning involves dividing a large table into smaller, more manageable pieces or partitions. Each partition contains a subset of the data and is stored separately. The key idea behind partitioning is to allow BigQuery to scan and process only the partitions that are relevant to a query, rather than scanning the entire table. This can lead to dramatic improvements in query performance and cost savings.

Why Are Partition Columns Important?

1. Query Performance

Partitioning a table based on a meaningful column, such as a timestamp or date, can significantly speed up query execution. When you run a query that includes a filter condition on the partitioning column, BigQuery can prune irrelevant partitions, scanning only the data that meets the criteria. This reduces query execution time, especially when dealing with large datasets.

For example, if you have a daily time-series dataset and partition it by date, querying data for a specific date range becomes much faster because BigQuery only needs to scan the partitions corresponding to that range.

2. Cost Efficiency

Improved query performance isn’t the only benefit of partition columns. It also translates into cost savings. BigQuery charges you based on the amount of data processed during a query. By scanning fewer partitions, you reduce the amount of data processed, leading to lower query costs. This cost reduction can be substantial for organizations with large datasets and frequent queries.

Query to Find partitioned column for all GCP bigquery tables

And so, I was looking for a way to find partitioned column for each table in our project. So we can improve our query performance and cost.

Following query will help show you partitioned column for each Bigquery table in your GCP Project

SELECT
  table_catalog AS project_id,
  table_schema AS dataset,
  table_name,
  partition_column
FROM (
  SELECT
    table_catalog,
    table_schema,
    table_name,
    CASE
      WHEN is_partitioning_column = "YES" THEN column_name
    ELSE
    NULL
  END
    AS partition_column,
    ROW_NUMBER() OVER(PARTITION BY table_catalog, table_schema, table_name ORDER BY is_partitioning_column DESC) AS rnk
  FROM
    <your_project>.<your_region>.INFORMATION_SCHEMA.COLUMNS
  )a
WHERE
  a.rnk = 1
Leave a Comment

GCP – Create Custom Bigquery Linage using DataCatalog Python API

In our GCP (google cloud platform) data warehousing workflow, we rely on GCP BigQuery for storing and analyzing data. However, the data ingestion process involves a different service that does not automatically show lineage in BigQuery. To address this limitation, I developed a Python utility that enables the creation of custom lineage for ingestion jobs using Dataplex Custom Linage Python Client.

Custom lineage creation involves three key tasks, each serving an essential purpose:

  1. Create a Lineage Process: This step allows us to define a name for the lineage process. Leveraging GCP Cloud Composer, I often use the DAG name as the process name, facilitating seamless linking of the ingestion tables to their respective processes.
  2. Create the Run: For every execution of the above process, we should create a new run. I assign the task ID as the run name, ensuring a unique identifier for each run.
  3. Create a Lineage Event: In the final task, I specify the source and target mapping along with associated details, effectively establishing the lineage relationship between the datasets.

Image depicting the GCP BigQuery Custom Lineage Process.
Exploring the data lineage process using GCP BigQuery and dataplex custom lineage python client.
Bigquery Linage Runs
Create Bigquery Custom Linage Runs using Dataplex Custom Linage Python Client
Bigquery Custom Run Details

Please find the entire code snippet on github

https://gist.github.com/Gaurang033/01ab9d4cedfb1049dd23dd30cd88cdad

Install Dependencies

google-cloud-datacatalog-lineage==0.2.3

Create Custom Linage Process

For process you can also add custom attributes, I have given an example of owner, framework and service.

def create_linage_process(project_id, process_display_name):
    parent = f"projects/{project_id}/locations/northamerica-northeast1"
    process = Process()
    process.display_name = process_display_name
    process.attributes = {
        "owner": "gaurangnshah@gmail.com",
        "framework": "file_ingestion_framework",
        "service": "databricks"
    }

    response = client.create_process(parent=parent, process=process)
    return response.name

Create Custom Linage Run

following code will help you create the custom run for the linage process we created

def create_run(process_id, start_time, end_time, state, run_display_name):
    run = lineage_v1.Run()
    run.start_time = start_time
    run.end_time = end_time
    run.state = state
    run.display_name = run_display_name
    run.attributes = {
        "owner": "gaurang",
        "purpose": "Testing Linage"
    }

    request = lineage_v1.CreateRunRequest(parent=process_id, run=run)
    response = client.create_run(request=request)
    logger.info(f"New run Created {response.name}")
    return response.name

Create Custom Linage Event

once you have linage run created you need to attach an even to that, event is nothing but source to target mapping. for both source and target you need to use fully qualified name with proper protocols. please visit following page to see all the supported protocols for source and target FQDN

https://cloud.google.com//data-catalog/docs/fully-qualified-names

def create_lineage_event(run_id, source_fqdn, target_fqdn, start_time, end_time):
    source = lineage_v1.EntityReference()
    target = lineage_v1.EntityReference()
    source.fully_qualified_name = source_fqdn
    target.fully_qualified_name = target_fqdn
    links = [EventLink(source=source, target=target)]
    lineage_event = LineageEvent(links=links, start_time=start_time, end_time=end_time)

    request = lineage_v1.CreateLineageEventRequest(parent=run_id, lineage_event=lineage_event)
    response = client.create_lineage_event(request=request)
    print("Lineage event created: %s", response.name)

Update Custom Linage Process

For us, it’s a same process which ingest new file into table, rather than creating new process every time, I am just updating the existing process to add new run and linage event.

def create_custom_linage_for_ingestion(project_id, process_display_name, source, target, start_time, end_time, state,
                                       run_display_name):
    process_id = create_linage_process(project_id, process_display_name=process_display_name)
    run_id = create_run(process_id=process_id, start_time=start_time, end_time=end_time, state=state,
                        run_display_name=run_display_name)
    create_lineage_event(run_id=run_id, start_time=start_time, end_time=end_time, source_fqdn=source,
                         target_fqdn=target)


def _get_process_id(project_id, process_display_name):
    parent = f"projects/{project_id}/locations/northamerica-northeast1"
    processes = client.list_processes(parent=parent)
    for process in processes:
        if process.display_name == process_display_name:
            return process.name
    return None


def _convert_to_proto_timestamp(timestamp):
    return timestamp.strftime('%Y-%m-%dT%H:%M:%S.%f')[:-3] + "Z"

How To Run?

if __name__ == '__main__':
    project_id = "<your_project_id>"
    process_display_name = "INGESTION_DAG_NAME"  ## DAG NAME
    source = "path:gs://<your_bucket_name>/test_schema/test_20230604.csv"
    target = "bigquery:<project_id>.gaurang.test_custom_linage"

    start_time = datetime.now() - timedelta(hours=3)
    process_start_time = _convert_to_proto_timestamp(start_time)  # Start time dag
    process_end_time = _convert_to_proto_timestamp(datetime.now())  # End Time

    state = "COMPLETED"
    run_display_name = "TASK_RUN_ID"
    create_or_update_custom_linage_for_ingestion(project_id, process_display_name, source, target, process_start_time,
                                                 process_end_time, state, run_display_name)
Leave a Comment

Google Bigquery – Find Query Cost By User

The organization I am currently consulting has recently migrated to the Google Cloud Platform (GCP) to leverage its powerful services, including Google BigQuery for efficient big data analysis. However, we have observed a significant increase in Query Execution costs and deemed it necessary to investigate the users or teams responsible for these expenses. By identifying the high spenders, we can provide them with valuable insights on optimizing query execution to minimize costs. It’s important to note that these users are transitioning from an on-premises environment where a CAPEX model was implemented, and they may not be fully aware of the cost implications associated with every query on GCP’s BigQuery. We aim to educate them on optimizing their queries to achieve the desired output while minimizing expenses effectively .

In this blog post, we will explore effective strategies to identify which teams or users are driving up costs

Use BigQuery Labels for Cost Attribution

To track query costs accurately, one option is to employ BigQuery labels. Although this method requires users to set labels manually before executing queries, it provides granular cost attribution. However, relying solely on users’ compliance may not always yield optimal results.

Leverage BigQuery Job Information Schema

BigQuery maintains detailed information for each job execution, including user details, slot utilization, and data processed. By querying the job information schema, you can calculate the query analysis cost per user accurately.

Ensure that the following permissions are granted to run this query:

  • bigquery.resourceViewer
  • bigquery.metadataViewer
SELECT
  user_email,
  SUM(total_cost) total_cost_per_user
FROM (
  SELECT
    reservation_id,
    user_email,
    CASE
      WHEN reservation_id IS NULL THEN (SUM(total_bytes_processed)/1024/1024/1024/1024)*5 -- 5 USD by TB processed 
      WHEN reservation_id is not null and reservation_id <> "default-pipeline" then (SUM(jbo.total_slot_ms)/(1000*60*60))*0.069 -- 0.69 USD per slot hour for northamerica-northeast1
  END
    AS total_cost
  FROM
    region-northamerica-northeast1.INFORMATION_SCHEMA.JOBS_BY_ORGANIZATION jbo
  WHERE
    DATE(creation_time) >= "2023-05-01" --change the filter 
  GROUP BY
    reservation_id,
    user_email )
GROUP BY
  user_email
ORDER BY
  total_cost_per_user DESC

Understand the Limitations of Cost Calculation using Information Schema

If your organization is utilizing on-demand pricing in BigQuery, the cost calculated through the information schema will closely align with the cost report.

However, if you organization is using auto-scalling slots, cost calculation through the information schema may not provide accurate results. While the information schema captures slot utilization during query execution, it doesn’t account for slots used during scale-up, scale-down, or the cooldown period. As a result, there may be discrepancies between the cost reported in the information schema and the actual cost shown in the cost report. This difference becomes more prominent for queries with shorter execution times (within 1 minute).

Looker Studio Reports for Quick Analysis and Visualization

To streamline the process of extracting query cost information, consider creating Looker Studio reports. These reports offer date filters, enabling quick access to the desired information. Additionally, Looker Studio reports provide a visual representation of query costs, facilitating a better understanding of cost trends and patterns.

Leave a Comment