The organization I am currently consulting has recently migrated to the Google Cloud Platform (GCP) to leverage its powerful services, including Google BigQuery for efficient big data analysis. However, we have observed a significant increase in Query Execution costs and deemed it necessary to investigate the users or teams responsible for these expenses. By identifying the high spenders, we can provide them with valuable insights on optimizing query execution to minimize costs. It’s important to note that these users are transitioning from an on-premises environment where a CAPEX model was implemented, and they may not be fully aware of the cost implications associated with every query on GCP’s BigQuery. We aim to educate them on optimizing their queries to achieve the desired output while minimizing expenses effectively .
In this blog post, we will explore effective strategies to identify which teams or users are driving up costs
Use BigQuery Labels for Cost Attribution
To track query costs accurately, one option is to employ BigQuery labels. Although this method requires users to set labels manually before executing queries, it provides granular cost attribution. However, relying solely on users’ compliance may not always yield optimal results.
Leverage BigQuery Job Information Schema
BigQuery maintains detailed information for each job execution, including user details, slot utilization, and data processed. By querying the job information schema, you can calculate the query analysis cost per user accurately.
Ensure that the following permissions are granted to run this query:
- bigquery.resourceViewer
- bigquery.metadataViewer
SELECT
  user_email,
  SUM(total_cost) total_cost_per_user
FROM (
  SELECT
    reservation_id,
    user_email,
    CASE
      WHEN reservation_id IS NULL THEN (SUM(total_bytes_processed)/1024/1024/1024/1024)*5 -- 5 USD by TB processed
      WHEN reservation_id is not null and reservation_id <> "default-pipeline" then (SUM(jbo.total_slot_ms)/(1000*60*60))*0.069 -- 0.69 USD per slot hour for northamerica-northeast1
  END
    AS total_cost
  FROM
    region-northamerica-northeast1.INFORMATION_SCHEMA.JOBS_BY_ORGANIZATION jbo
  WHERE
    DATE(creation_time) >= "2023-05-01" --change the filter
  GROUP BY
    reservation_id,
    user_email )
GROUP BY
  user_email
ORDER BY
  total_cost_per_user DESC
Understand the Limitations of Cost Calculation using Information Schema
If your organization is utilizing on-demand pricing in BigQuery, the cost calculated through the information schema will closely align with the cost report.
However, if you organization is using auto-scalling slots, cost calculation through the information schema may not provide accurate results. While the information schema captures slot utilization during query execution, it doesn’t account for slots used during scale-up, scale-down, or the cooldown period. As a result, there may be discrepancies between the cost reported in the information schema and the actual cost shown in the cost report. This difference becomes more prominent for queries with shorter execution times (within 1 minute).
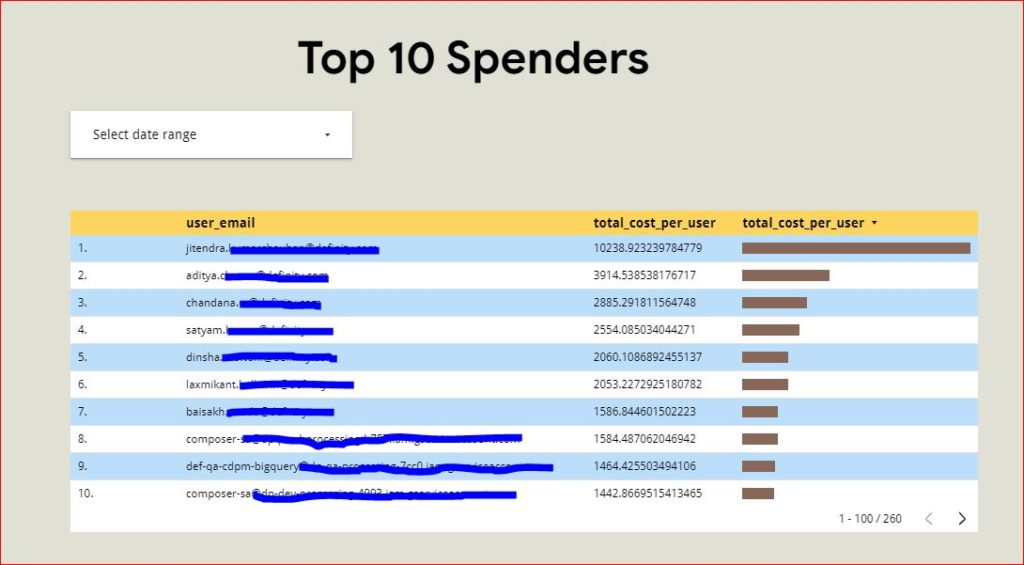
Looker Studio Reports for Quick Analysis and Visualization
To streamline the process of extracting query cost information, consider creating Looker Studio reports. These reports offer date filters, enabling quick access to the desired information. Additionally, Looker Studio reports provide a visual representation of query costs, facilitating a better understanding of cost trends and patterns.