Skip to content

Tag: gcp

GCP Cloud Composer – Configure Hashicorp Vault to store connection and variables

Airflow providers multiple secrets backends to be configured for storing airflow connection and variables. for a long time we were using airflow backends however recently I migrated all the connection to vault and started using vault as our backend. In this post I will show you a step by step guide on how to do this.

Configure HashiCorp Vault

create mount point

we have multiple composer(airflow) environment and so strategy we have used is created a single mount point named airflow and then use the different path for different airflow instances. you could choose to have different strategy as per your organization standard and requirement. Run the following command to create the secrets mount point.

vault secrets enable -path=airflow -version=2 kv

Create role

vault provides multiple ways to authenticate, what we are going to use is role. so let’s create a role. please copy the secret id from the output and store it somewhere. this would be useful when we will vault connection in airflow.

vault write auth/approle/role/gcp_composer_role \
    role_id=gcp_composer_role \
    secret_id_ttl=0 \
    secret_id_num_uses=0 \
    token_num_uses=0 \
    token_ttl=24h \
    token_max_ttl=24h \
    token_policies=gcp_composer_policy

Create Policy

role need to be associated with a policy. policy is nothing but a grant (access). Run the following code to create a policy which would give read and list permission to airflow path, we created earlier.

vault policy write gcp_composer_policy - <<EOF
path "airflow/*" {
  capabilities = ["read", "list"]
}
EOF

now are are all set in vault. let’s change the airflow configuration to start using vault.

Configure Airflow (GCP Cloud Composer)

Navigate to your airflow instances and override following two settings.

  • secrets.backend = airflow.providers.hashicorp.secrets.vault.VaultBackend
  • secrets.backend_kwargs
{
"mount_point": "airflow", 
"connections_path": "dev-composer/connections" , 
"variables_path": null, 
"config_path": null, 
"url": "<your_vault_url>", 
"auth_type": "approle", 
"role_id":"gcp_composer_role", 
"secret_id":"<your_secret_id>"
}

connection_path: path where you would like to store your airflow connection. for me it’s my composer name and then connection. if you have single airflow you could just store everything under connection.
variables_path: i have specified null as I am storing variables in airflow. if you want to store variables also in vault, just provide the path.
config_path: same as variables, I am keeping config in airflow
url: replace with you vault url
auth_type: we are using approle to authenticate with vault as discussed above
role_id: the role we created above. if you have used different name, please replace here.
secret_id: secret_id we generated for the role

How to store connections

for connection create a path with connection name and put the json with proper key and value for connection. for example, default bigquery connection. it would look like this.

mount point: airflow
Path: dev-composer/connections/bigquery_default

{
  "conn_type": "google_cloud_platform",
  "description": "",
  "extra": "{\"extra__google_cloud_platform__project\": \"youre_project\", \"extra__google_cloud_platform__key_path\": \"\", \"extra__google_cloud_platform__key_secret_name\": \"\", \"extra__google_cloud_platform__keyfile_dict\": \"\", \"extra__google_cloud_platform__num_retries\": 5, \"extra__google_cloud_platform__scope\": \"\"}",
  "host": "",
  "login": "",
  "password": null,
  "port": null,
  "schema": ""
}

How to store variables

for variables. in the json key would alway be value. as shows below

mount point: airflow
path: dev-composer/variables/raw_project_name

{
  "value": "raw_project_id"
}
Leave a Comment

GCP Cloud Composer – Things to consider before implementation

When planning to use Google Cloud Composer (Airflow in GCP), there are few essential considerations to address before setup. While these can be configured post-setup, it would be a tedious and time-consuming task.

TimeZone for scheduler

he default time for the scheduler is UTC. This means if you schedule a DAG to run at 5 PM, it will run at 5 PM UTC, not your local time. Calculating this for each DAG deployment is impractical. It’s advisable to change the default scheduling time.
To change this:

  • Navigate to your airflow instance
  • Go to airflow configuration overrides.
  • click on edit and choose the time zone you want for core.default_timezone

Where to store airflow connection and variables

By default, Airflow (Google Cloud Composer) stores connections and variables within Airflow itself. However, it supports multiple external backends, including GCP, AWS, and HashiCorp Vault. Airflow does not version these connections or variables nor provides granular access control, making it prudent to store them externally. Organizational standards often require storing all secrets and certificates in a single system.

In our setup, we chose to store connections in HashiCorp Vault due to their sensitive nature, while non-sensitive variables remained in Airflow.

One key point to note: Airflow adds new backends as extra backends. If it cannot find a variable or connection in the external backend (e.g., Vault), it will search within Airflow itself.

Default Role assignment for All Airflow Users

Airflow has built-in RBAC with five main roles: public, viewer, user, op, admin. The default role assigned to all users in GCP is ‘op’.

If this role doesn’t fit your organizational needs, create a custom role and change the default role assignment.

In our scenario, the ‘op’ role includes permissions to create and maintain connections and variables. Since we maintain all connections in HashiCorp Vault, we didn’t want duplicates created within Airflow. Therefore, we created a custom role without these permissions and set it as the default role for all users. To change the default role, override webserver.rbac_user_registration_role to the custom role.

By addressing these configurations early on, you can streamline your use of Google Cloud Composer and Airflow in GCP, ensuring efficient and secure operations.

Leave a Comment

GCP Security – Finding Zero Trust Policy issues using IAM policy Recommander

In our previous blog posts, we explored leveraging Google Recommender for cost optimization. Now, let’s dive into identifying security issues within your Google Cloud Platform (GCP) environment using Google Recommender. If you missed the previous post on redirecting recommendations to BigQuery, I highly recommend giving it a read, as it lays out the groundwork for our current discussion.

Adhering to the principles of a zero trust policy, it’s crucial to ensure that individuals or service accounts only possess the permissions they truly require. Google Recommender plays a pivotal role in this aspect. By examining policy insights, if it’s flagged that a principal holds unnecessary permissions within their role, the IAM Recommender steps in to evaluate whether these permissions can be revoked or if there’s a more suitable role available. If revocation is possible, the IAM Recommender generates a recommendation to revoke the role. Alternatively, if there’s a better-suited role, it suggests replacing the existing one with the suggested role. This replacement could entail a new custom role, an existing custom role, or predefined roles.

If you’ve already redirected all recommendations to BigQuery, you can run the following query to gain insights into any surplus permissions held by individuals or service accounts. Furthermore, it will provide recommendations regarding roles that may need to be removed or replaced with more stringent alternatives.

SQL to find GCP IAM recommendation

SELECT
  cloud_entity_type,
  cloud_entity_id,
  recommendation_details,
  recommender_subtype,
  JSON_VALUE(recommendation_details, "$.overview.member") AS user,
  JSON_VALUE(recommendation_details, "$.overview.removedRole") AS existing_role,
  JSON_QUERY_ARRAY(recommendation_details, "$.overview.addedRoles") AS new_role,
  priority,
  JSON_VALUE(recommendation_details, "$.overview.minimumObservationPeriodInDays") AS minimumObservationPeriodInDays
FROM
  your_project.recommendations.recommendations_export`
WHERE
  recommender = "google.iam.policy.Recommender"
  AND state = "ACTIVE"
  AND TIMESTAMP_TRUNC(_PARTITIONTIME, DAY) = (
    SELECT
      TIMESTAMP_TRUNC(MAX(_PARTITIONTIME), DAY)
    FROM
      your_project.recommendations.recommendations_export
  )
  • minimumObservationPeriodInDays: Additionally, it’s worth noting that the IAM Recommender only begins generating role recommendations once it has gathered a certain amount of permission usage data. By default, the minimum observation period is set to 90 days. However, for project-level role recommendations, you have the flexibility to manually adjust it to 30 or 60 days. If you wish to modify this setting, you can do so by visiting the following link: Configure Role Recommendations.
  • cloud_entity_type: shows if issue is at org level, folder level or project level
  • cloud_entity_id: shows you the id of the org, project or folder. you can use this id in you GCP console to search for particular entity.
  • recommender_subtype: will show you weather to remove role or replace role with another role, or if someone service account is using default role.
  • user: Principle (user or service account) for which recommandation has generated
  • existing_role: show you the existing role
  • new_role: role you should replace existing role with, in case when recommand_subtype is remove_role this would be empty.
  • priority: priority of a particular recommandation.
Leave a Comment

Optimize Your GCP Cloud Costs: Identifying Compute Engine Resources for Scale Down

In our ongoing exploration of cloud cost optimization, we’re constantly seeking ways to maximize efficiency and minimize expenditure. In our previous blog post, we discussed the importance of centralizing recommendations within BigQuery to streamline cost analysis. If you haven’t had the chance to read that article, I highly recommend doing so, as it lays the groundwork for the strategy we’re about to delve into.

Now, let’s dive into a powerful BigQuery query designed to uncover Compute Engine resources prime for scale down, further enhancing your cost optimization efforts.

Unveiling the Query

SELECT
   r,
  SPLIT(r, "/")[4] AS project_name,
  ARRAY_REVERSE(SPLIT(r, "/"))[0] AS resource_name,
   recommender_subtype as action,
  description,
  primary_impact.cost_projection.cost_in_local_currency. units AS cost_savings_per_month
FROM
  <your_project>.recommendations.recommendations_export,
  UNNEST(target_resources) r
WHERE
  recommender_subtype = "CHANGE_MACHINE_TYPE"
  AND TIMESTAMP_TRUNC(_PARTITIONTIME, DAY) = (
  SELECT
    TIMESTAMP_TRUNC(MAX(_PARTITIONTIME), DAY)
  FROM
    <your_project>.recommendations.recommendations_export)

Breaking Down the Query

  1. SELECT: The query selects essential fields like the resource and project names, recommendation action, description, and projected cost savings per month.
  2. FROM: It sources data from recommendations.recommendations_export, extracting target resources using UNNEST.
  3. WHERE: Filters recommendations to focus solely on those advocating for changing machine types. Additionally, it ensures we’re working with the latest data partition.

What It Means for You

By running this query, you gain insights into Compute Engine resources where adjusting machine types could lead to substantial cost savings. Each recommendation is accompanied by a description and projected monthly savings, empowering you to make informed decisions about scaling down resources without sacrificing performance.

Conclusion

Cost optimization in the cloud isn’t just about cutting corners; it’s about strategic resource allocation. With the provided BigQuery query, identifying Compute Engine resources ripe for scale down becomes a streamlined process. Embrace data-driven decision-making to optimize your cloud costs effectively.

Stay tuned for more insights and tips on maximizing the value of your cloud investments!

Remember, when it comes to cloud cost optimization, every adjustment counts. Start uncovering opportunities for savings today with our BigQuery-powered approach. Your bottom line will thank you.

Would you like to dive deeper into any specific aspect or have further queries? Feel free to reach out!

Leave a Comment

Unlocking GCP Cost Optimization Using Recommendation and BigQuery: A FinsOps Guide

In recent days, I was working on costs optimization on the Google Cloud Platform (GCP) . Google offers recommendations for cost savings and security at the project level. However, managing these recommendations across numerous projects can be arduous, particularly in scenarios like mine where we oversee approximately 100 projects, with limited access to many. Fortunately, redirecting all recommendations to BigQuery and leveraging SQL’s analytical capabilities proved to be a game-changer. Additionally, configuring Looker Studio facilitated streamlined visualization.

In this blog post, I’ll illustrate the process of redirecting GCP recommendations to Google BigQuery and uncovering cost-saving recommendations specifically for idle resources.

Redirecting GCP Recommendations to BigQuery

  • you will need a service account created at org level with following roles
    • roles/bigquery.dataEditor
    • roles/recommender.exporter
  • Choose a project to which you want to send GCP recommandation, in our case we have created a separate project for billing and recommendation. Seperate project makes it easier for access control.
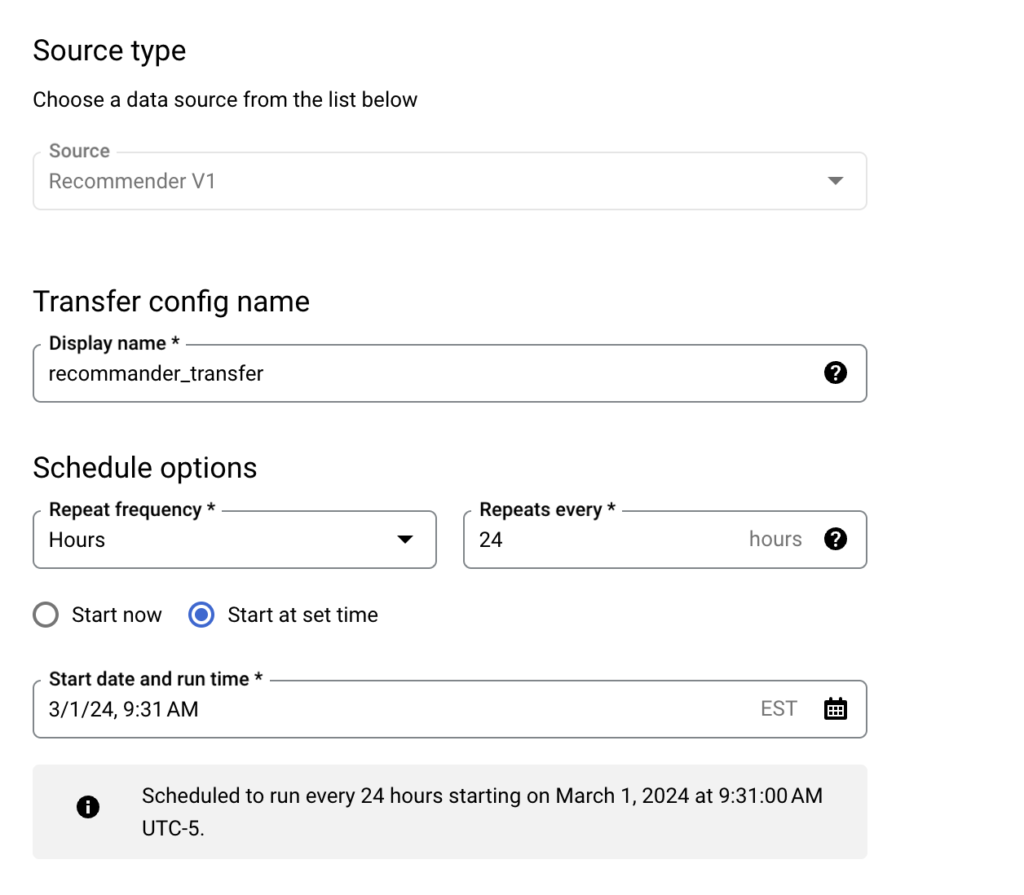
  • Now navigate to google bigquery and open data transfers from left side menu and click on CREATE TANSFERS.
  • Choose the Recommander V1 from the option as shown in screenshot below and fill our other information
  • Once the data transfer is executed successfully you will be able to see following two tables in the dataset
    • insights_export
    • recommendations_export

Analyse Data For GCP for Cost Saving

Following query will give you list of all the idle resources which could be either deleted or shutdown to save cost. Query will show you project name, resource name, action to be taken, description and how much you will cost you will be saving in your local currency.

SELECT
  r,
  SPLIT(r, "/")[4] AS project_name,
  ARRAY_REVERSE(SPLIT(r, "/"))[0] AS resource_name,
   recommender_subtype as action,
  description,
  primary_impact.cost_projection.cost_in_local_currency. units AS cost_savings_per_month
FROM
  you_project.dataset.recommendations_export,
  UNNEST(target_resources) AS r
WHERE
  TIMESTAMP_TRUNC(_PARTITIONTIME, DAY) = (select TIMESTAMP_TRUNC(max(_PARTITIONTIME), DAY) from your_project.your_dataset.recommendations_export)
  AND primary_impact.category = "COST"
  AND state = "ACTIVE"
  AND recommender LIKE "%IdleResourceRecommender"

Visualizing Data

In order to track if we are implementing this suggestion or not I further created a dashboard using looker studio.

Query for looker studio dashboard.

Following query will give you cost optimization recommendation of last 30 days.

SELECT
  r,
  SPLIT(r, "/")[4] AS project_name,
  ARRAY_REVERSE(SPLIT(r, "/"))[0] AS resource_name,
   recommender_subtype as action,
  description,
  primary_impact.cost_projection.cost_in_local_currency. units AS cost_savings_per_month, 
  state, 
  date(last_refresh_time) as date
FROM
  you_project.dataset.recommendations_export,
  UNNEST(target_resources) AS r
WHERE
  TIMESTAMP_TRUNC(_PARTITIONTIME, DAY) > TIMESTAMP(current_date() - 30)
  AND primary_impact.category = "COST"
  AND state = "ACTIVE"
  AND recommender LIKE "%IdleResourceRecommender"

Dashboard

This dashboard provides valuable insights indicating that our efforts towards cost optimization are bearing fruit. The noticeable decrease in overall recommendations signifies successful implementation of our strategies, affirming that we are indeed on the right track.

Leave a Comment

Data Mesh implementation with GCP BigQuery

In today’s data-driven landscape, organizations often have multiple teams comprising domain experts who create their own unique products. However, enabling other teams to leverage these products efficiently requires a structured approach. Enter data mesh—a paradigm that decentralizes data ownership and processing. In this guide, we’ll explore how to implement data mesh using Google Cloud Platform (GCP) BigQuery, empowering teams to manage their data products seamlessly.

Setting up Domain-Specific GCP Projects

Begin by assigning a dedicated GCP project to each domain or business team. This ensures that teams have the autonomy to develop and manage their data products within their respective environments. By segregating projects based on domains, teams can focus on their specific requirements without interfering with others’ workflows.

Development and Promotion Workflow

Within their assigned GCP projects, domain teams develop their data products tailored to their expertise. These products undergo rigorous testing and refinement in the development environment. However, it’s crucial to avoid publishing directly from the development environment to prevent potential disruptions for subscribers. Frequent changes in the development phase can lead to compatibility issues and operational challenges for downstream users.

Promotion to Higher Environments

Once a data product is deemed ready for consumption, it’s promoted to higher environments, typically housed in different GCP projects. This transition ensures that only validated and stable versions of products are made available to subscribers. By segregating development and production environments, organizations can maintain data integrity and stability while minimizing disruptions to subscriber workflows.

Publishing Data Products

When promoting a data product to a higher environment, a team lead assumes the responsibility of publishing it. This involves orchestrating a seamless transition and ensuring that subscribers can access the updated version without interruptions.

Make sure Analytics Hub API is enabled for this.

Follow these steps to publish your product:

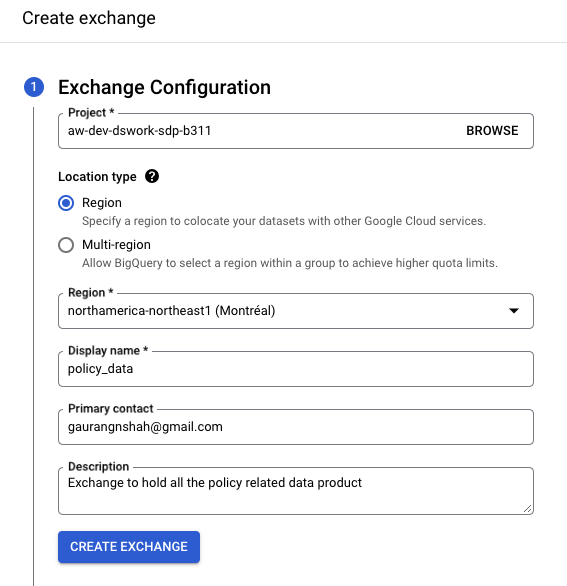
  1. Navigate to GCP BigQuery and access Analytics Hub. Click on “Create Exchange.”
  2. Depending on the nature of your product, provide the necessary details and proceed by clicking “Create Exchange.”
    create exchange to hold data products in GCP bigquery Analytics Hub
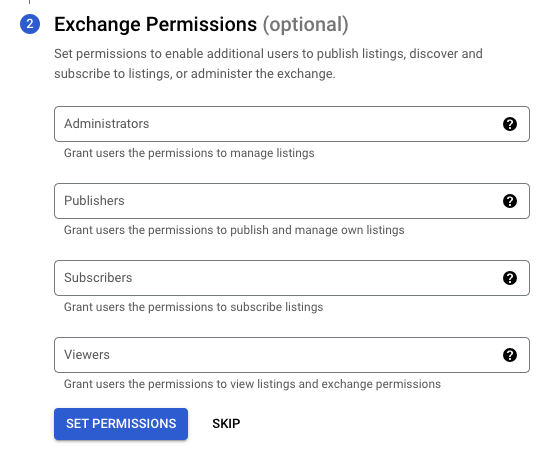
  3. At this stage, you’ll have the option to configure permissions for administration, publishing, subscription, and viewing of the listing. You can either set these permissions now or configure them later.
    GCP Bigquery Analytics Hub Exchange Permission setting
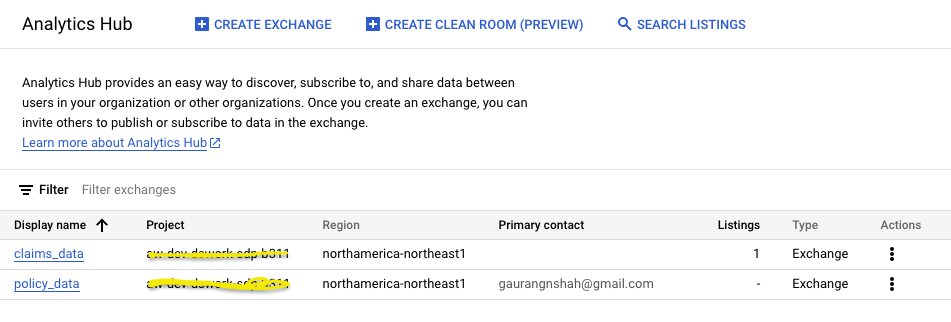
  4. Once the exchange is created, proceed to create a listing for it. A listing involves selecting the dataset you wish to publish. Currently, GCP BigQuery only allows choosing datasets only. And depends on what location you choose for your exchange you should be able to select datasets.
    GCP bigquery Analytics hub listing.
  5. Provide the required Listing Details and Listing Contact Information corresponding to your data product. Once completed, you’ll be able to publish the dataset through the listing.

    Listing ready to publishImplement data mesh using GCP BigQuery Analytics Hub

Subscribing to the Data Products (listings)

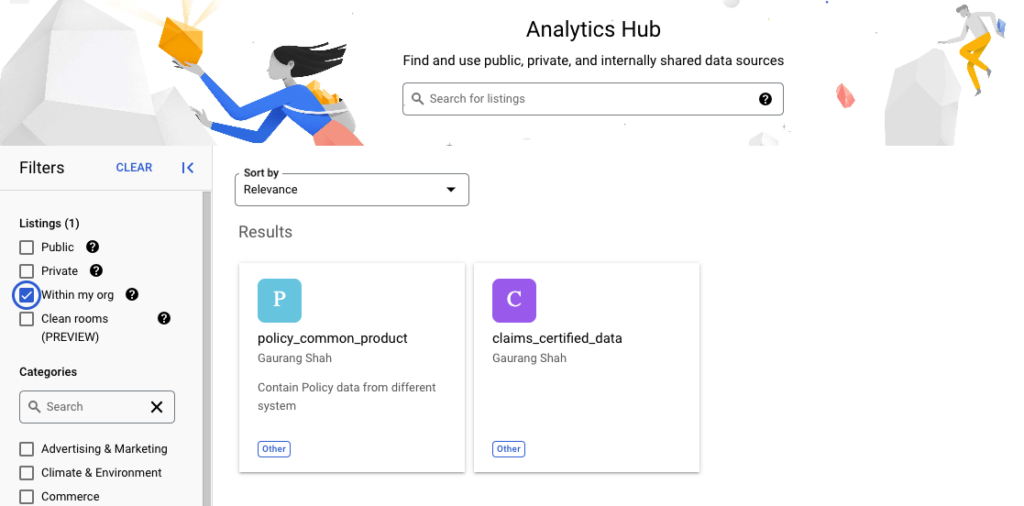
  • Once the Data Product is published other users can search and subscribe to this listing. User would need access to create a new Dataset in the project they want to subscribe this new data products.

Leave a Comment

GCP Bigquery – Find Partition column for each table

What Are Partition Columns?

In BigQuery, tables can be partitioned based on particular column. Partitioning involves dividing a large table into smaller, more manageable pieces or partitions. Each partition contains a subset of the data and is stored separately. The key idea behind partitioning is to allow BigQuery to scan and process only the partitions that are relevant to a query, rather than scanning the entire table. This can lead to dramatic improvements in query performance and cost savings.

Why Are Partition Columns Important?

1. Query Performance

Partitioning a table based on a meaningful column, such as a timestamp or date, can significantly speed up query execution. When you run a query that includes a filter condition on the partitioning column, BigQuery can prune irrelevant partitions, scanning only the data that meets the criteria. This reduces query execution time, especially when dealing with large datasets.

For example, if you have a daily time-series dataset and partition it by date, querying data for a specific date range becomes much faster because BigQuery only needs to scan the partitions corresponding to that range.

2. Cost Efficiency

Improved query performance isn’t the only benefit of partition columns. It also translates into cost savings. BigQuery charges you based on the amount of data processed during a query. By scanning fewer partitions, you reduce the amount of data processed, leading to lower query costs. This cost reduction can be substantial for organizations with large datasets and frequent queries.

Query to Find partitioned column for all GCP bigquery tables

And so, I was looking for a way to find partitioned column for each table in our project. So we can improve our query performance and cost.

Following query will help show you partitioned column for each Bigquery table in your GCP Project

SELECT
  table_catalog AS project_id,
  table_schema AS dataset,
  table_name,
  partition_column
FROM (
  SELECT
    table_catalog,
    table_schema,
    table_name,
    CASE
      WHEN is_partitioning_column = "YES" THEN column_name
    ELSE
    NULL
  END
    AS partition_column,
    ROW_NUMBER() OVER(PARTITION BY table_catalog, table_schema, table_name ORDER BY is_partitioning_column DESC) AS rnk
  FROM
    <your_project>.<your_region>.INFORMATION_SCHEMA.COLUMNS
  )a
WHERE
  a.rnk = 1
Leave a Comment

GCP – Create Custom Bigquery Linage using DataCatalog Python API

In our GCP (google cloud platform) data warehousing workflow, we rely on GCP BigQuery for storing and analyzing data. However, the data ingestion process involves a different service that does not automatically show lineage in BigQuery. To address this limitation, I developed a Python utility that enables the creation of custom lineage for ingestion jobs using Dataplex Custom Linage Python Client.

Custom lineage creation involves three key tasks, each serving an essential purpose:

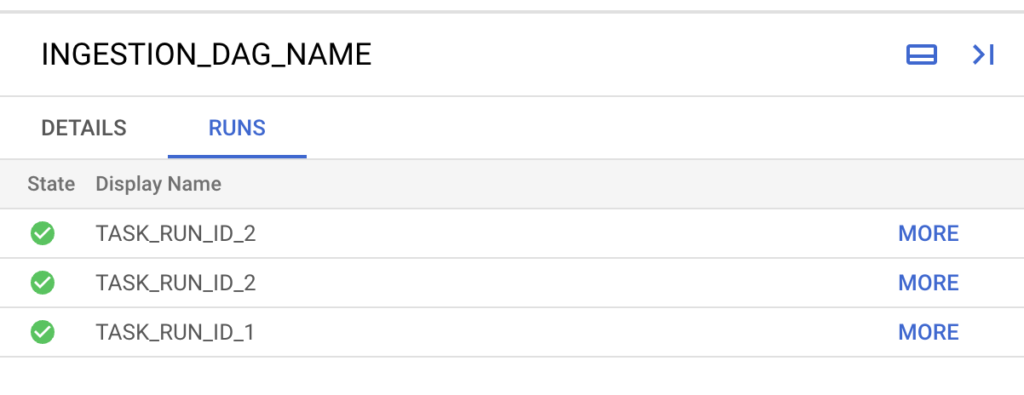
  1. Create a Lineage Process: This step allows us to define a name for the lineage process. Leveraging GCP Cloud Composer, I often use the DAG name as the process name, facilitating seamless linking of the ingestion tables to their respective processes.
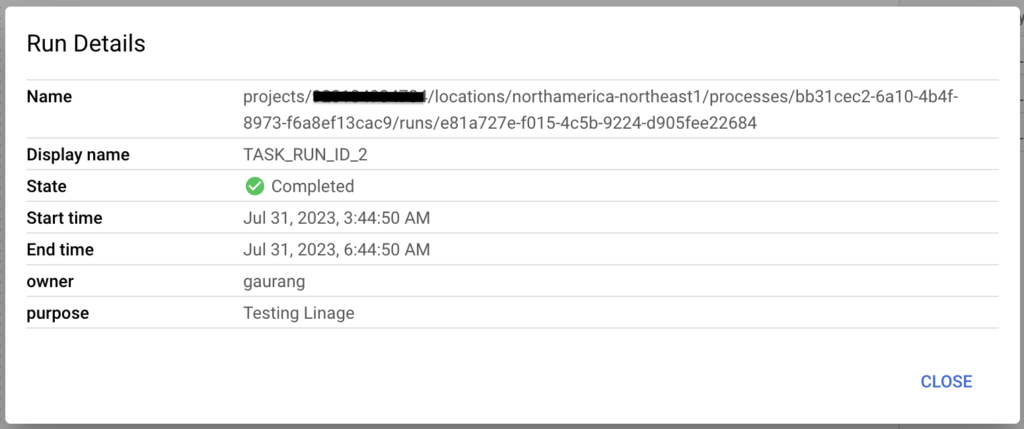
  2. Create the Run: For every execution of the above process, we should create a new run. I assign the task ID as the run name, ensuring a unique identifier for each run.
  3. Create a Lineage Event: In the final task, I specify the source and target mapping along with associated details, effectively establishing the lineage relationship between the datasets.

Image depicting the GCP BigQuery Custom Lineage Process.
Exploring the data lineage process using GCP BigQuery and dataplex custom lineage python client.
Bigquery Linage Runs
Create Bigquery Custom Linage Runs using Dataplex Custom Linage Python Client
Bigquery Custom Run Details

Please find the entire code snippet on github

https://gist.github.com/Gaurang033/01ab9d4cedfb1049dd23dd30cd88cdad

Install Dependencies

google-cloud-datacatalog-lineage==0.2.3

Create Custom Linage Process

For process you can also add custom attributes, I have given an example of owner, framework and service.

def create_linage_process(project_id, process_display_name):
    parent = f"projects/{project_id}/locations/northamerica-northeast1"
    process = Process()
    process.display_name = process_display_name
    process.attributes = {
        "owner": "gaurangnshah@gmail.com",
        "framework": "file_ingestion_framework",
        "service": "databricks"
    }

    response = client.create_process(parent=parent, process=process)
    return response.name

Create Custom Linage Run

following code will help you create the custom run for the linage process we created

def create_run(process_id, start_time, end_time, state, run_display_name):
    run = lineage_v1.Run()
    run.start_time = start_time
    run.end_time = end_time
    run.state = state
    run.display_name = run_display_name
    run.attributes = {
        "owner": "gaurang",
        "purpose": "Testing Linage"
    }

    request = lineage_v1.CreateRunRequest(parent=process_id, run=run)
    response = client.create_run(request=request)
    logger.info(f"New run Created {response.name}")
    return response.name

Create Custom Linage Event

once you have linage run created you need to attach an even to that, event is nothing but source to target mapping. for both source and target you need to use fully qualified name with proper protocols. please visit following page to see all the supported protocols for source and target FQDN

https://cloud.google.com//data-catalog/docs/fully-qualified-names

def create_lineage_event(run_id, source_fqdn, target_fqdn, start_time, end_time):
    source = lineage_v1.EntityReference()
    target = lineage_v1.EntityReference()
    source.fully_qualified_name = source_fqdn
    target.fully_qualified_name = target_fqdn
    links = [EventLink(source=source, target=target)]
    lineage_event = LineageEvent(links=links, start_time=start_time, end_time=end_time)

    request = lineage_v1.CreateLineageEventRequest(parent=run_id, lineage_event=lineage_event)
    response = client.create_lineage_event(request=request)
    print("Lineage event created: %s", response.name)

Update Custom Linage Process

For us, it’s a same process which ingest new file into table, rather than creating new process every time, I am just updating the existing process to add new run and linage event.

def create_custom_linage_for_ingestion(project_id, process_display_name, source, target, start_time, end_time, state,
                                       run_display_name):
    process_id = create_linage_process(project_id, process_display_name=process_display_name)
    run_id = create_run(process_id=process_id, start_time=start_time, end_time=end_time, state=state,
                        run_display_name=run_display_name)
    create_lineage_event(run_id=run_id, start_time=start_time, end_time=end_time, source_fqdn=source,
                         target_fqdn=target)


def _get_process_id(project_id, process_display_name):
    parent = f"projects/{project_id}/locations/northamerica-northeast1"
    processes = client.list_processes(parent=parent)
    for process in processes:
        if process.display_name == process_display_name:
            return process.name
    return None


def _convert_to_proto_timestamp(timestamp):
    return timestamp.strftime('%Y-%m-%dT%H:%M:%S.%f')[:-3] + "Z"

How To Run?

if __name__ == '__main__':
    project_id = "<your_project_id>"
    process_display_name = "INGESTION_DAG_NAME"  ## DAG NAME
    source = "path:gs://<your_bucket_name>/test_schema/test_20230604.csv"
    target = "bigquery:<project_id>.gaurang.test_custom_linage"

    start_time = datetime.now() - timedelta(hours=3)
    process_start_time = _convert_to_proto_timestamp(start_time)  # Start time dag
    process_end_time = _convert_to_proto_timestamp(datetime.now())  # End Time

    state = "COMPLETED"
    run_display_name = "TASK_RUN_ID"
    create_or_update_custom_linage_for_ingestion(project_id, process_display_name, source, target, process_start_time,
                                                 process_end_time, state, run_display_name)
Leave a Comment

Google Bigquery – Find Query Cost By User

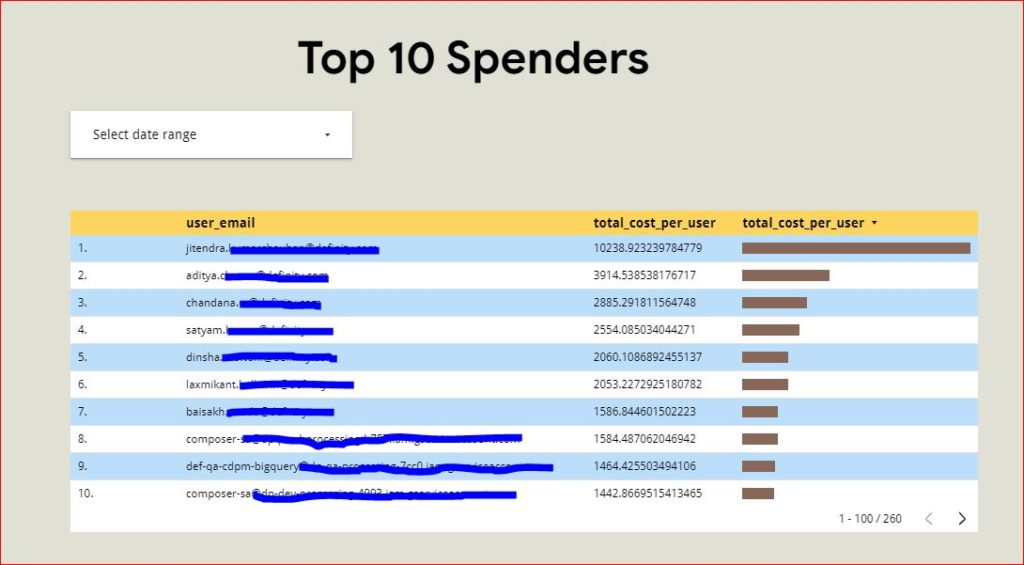
The organization I am currently consulting has recently migrated to the Google Cloud Platform (GCP) to leverage its powerful services, including Google BigQuery for efficient big data analysis. However, we have observed a significant increase in Query Execution costs and deemed it necessary to investigate the users or teams responsible for these expenses. By identifying the high spenders, we can provide them with valuable insights on optimizing query execution to minimize costs. It’s important to note that these users are transitioning from an on-premises environment where a CAPEX model was implemented, and they may not be fully aware of the cost implications associated with every query on GCP’s BigQuery. We aim to educate them on optimizing their queries to achieve the desired output while minimizing expenses effectively .

In this blog post, we will explore effective strategies to identify which teams or users are driving up costs

Use BigQuery Labels for Cost Attribution

To track query costs accurately, one option is to employ BigQuery labels. Although this method requires users to set labels manually before executing queries, it provides granular cost attribution. However, relying solely on users’ compliance may not always yield optimal results.

Leverage BigQuery Job Information Schema

BigQuery maintains detailed information for each job execution, including user details, slot utilization, and data processed. By querying the job information schema, you can calculate the query analysis cost per user accurately.

Ensure that the following permissions are granted to run this query:

  • bigquery.resourceViewer
  • bigquery.metadataViewer
SELECT
  user_email,
  SUM(total_cost) total_cost_per_user
FROM (
  SELECT
    reservation_id,
    user_email,
    CASE
      WHEN reservation_id IS NULL THEN (SUM(total_bytes_processed)/1024/1024/1024/1024)*5 -- 5 USD by TB processed 
      WHEN reservation_id is not null and reservation_id <> "default-pipeline" then (SUM(jbo.total_slot_ms)/(1000*60*60))*0.069 -- 0.69 USD per slot hour for northamerica-northeast1
  END
    AS total_cost
  FROM
    region-northamerica-northeast1.INFORMATION_SCHEMA.JOBS_BY_ORGANIZATION jbo
  WHERE
    DATE(creation_time) >= "2023-05-01" --change the filter 
  GROUP BY
    reservation_id,
    user_email )
GROUP BY
  user_email
ORDER BY
  total_cost_per_user DESC

Understand the Limitations of Cost Calculation using Information Schema

If your organization is utilizing on-demand pricing in BigQuery, the cost calculated through the information schema will closely align with the cost report.

However, if you organization is using auto-scalling slots, cost calculation through the information schema may not provide accurate results. While the information schema captures slot utilization during query execution, it doesn’t account for slots used during scale-up, scale-down, or the cooldown period. As a result, there may be discrepancies between the cost reported in the information schema and the actual cost shown in the cost report. This difference becomes more prominent for queries with shorter execution times (within 1 minute).

Looker Studio Reports for Quick Analysis and Visualization

To streamline the process of extracting query cost information, consider creating Looker Studio reports. These reports offer date filters, enabling quick access to the desired information. Additionally, Looker Studio reports provide a visual representation of query costs, facilitating a better understanding of cost trends and patterns.

Leave a Comment

Airflow Operational Dashboard using Bigquery and Looker Studio

In our daily operations, we rely on Airflow (Cloud Composer) to run hundreds of dags. While we have integrated it with ServiceNow and SMTP for airflow notifications, we found that these measures were insufficient in providing us with valuable insights. We needed a way to track the number of failed dags over a specific period, identify which dags were failing more frequently, and gain a comprehensive understanding of our workflow performance.

To address these challenges, we decided to create a Looker Studio dashboard by leveraging the power of BigQuery and redirecting Airflow (Cloud Composer) logs through a log sink. By storing our logs in BigQuery, we gained access to a wealth of data that allowed us to generate informative charts and visualizations. In this blog post, I will guide you through the step-by-step process of setting up this invaluable solution.

Create a Log Sink

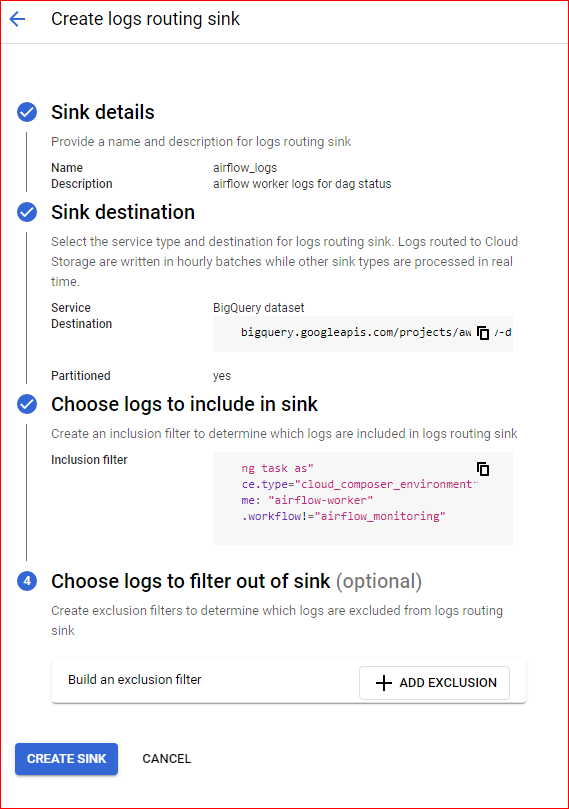
To begin the process, navigate to the log router and create a sink using the following query. When configuring the sink, select the desired target as a BigQuery dataset where you want all the logs to be redirected. Additionally, it is recommended to choose a partitioned table, as this will optimize query performance, facilitate the cleanup of older logs, and reduce costs. By partitioning the table, BigQuery will scan less data when querying specific time ranges, resulting in faster results and more efficient resource usage.

"Marking task as"
resource.type="cloud_composer_environment"
log_name: "airflow-worker"
labels.workflow!="airflow_monitoring"
log sink to redirect airflow logs to bigquery for looker studio dashboard

Upon successful creation of the log sink you would be able to see airflow_worker table created in the dataset you have specified during the log sink configuration.

Write a query to get insight

Following query retrives the data from airflow_worker table and

  • Adjusting timestamps to “America/Toronto” timezone: Airflow (Cloud Composer) logs are stored in UTC timestamps by default. However, our scheduler is set to the “America/Toronto” timezone. To ensure consistency, I’m converting the timestamps to the “America/Toronto” timezone. Keep in mind that you may need to modify this part based on your own timezone settings.
  • Retrieving status information: The status of each Airflow DAG is captured in the textPayload column. I’m using regular expressions to extract one of three possible statuses: “Success,” “Fail,” or “Skip.” This allows us to easily identify the execution outcome of each DAG run.
    Since status information is only available at task level, I am considering dag as failed if any task within the dag has failed. if you choose to show information at task level you might need to modify this query.
SELECT
  *
FROM (
  SELECT
    DATE(timestamp, "America/Toronto") AS execution_date, -- this is UTC date 
    datetime(timestamp, "America/Toronto") as execution_timestamp, 
    labels.workflow,
    DATE(CAST(labels.execution_date AS timestamp), "America/Toronto") AS schedule_date, -- UTC Date 
    datetime(cast(labels.execution_date AS timestamp), "America/Toronto") AS schedule_timestamp, --- UTC timestamp 
    labels.try_number,
    CASE
      WHEN CONTAINS_SUBSTR(textPayload, "Success") THEN "success"
      WHEN CONTAINS_SUBSTR(textPayload, "SKIPPED") THEN "skip"
    ELSE
    "fail"
  END
    AS status,
    ROW_NUMBER() OVER(PARTITION BY labels.workflow, CAST(labels.execution_date AS timestamp)
    ORDER BY
      CASE
        WHEN CONTAINS_SUBSTR(textPayload, "Success") THEN 1
        WHEN CONTAINS_SUBSTR(textPayload, "SKIPPED") THEN 2
      ELSE
      0
    END
      ) AS rnk
  FROM
    ss-org-logging-project.airflow_dags_status.airflow_worker )
WHERE
  rnk = 1  

Dashboard.

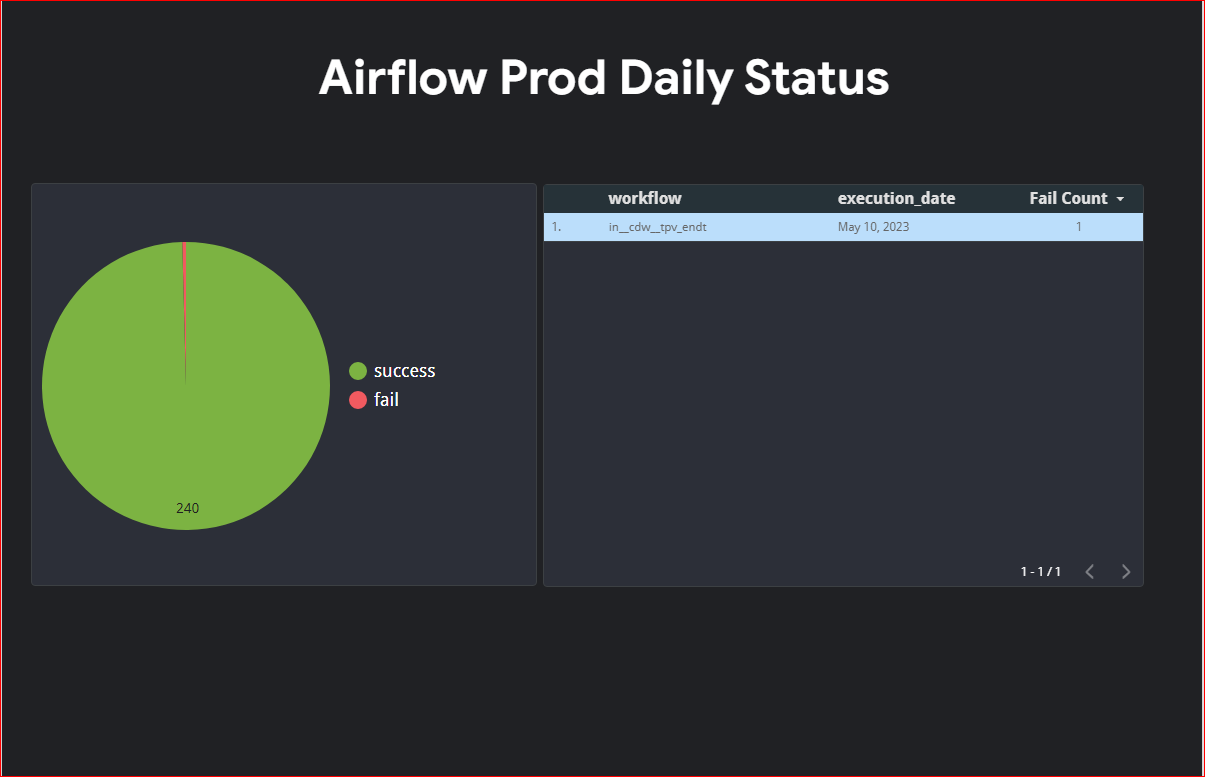
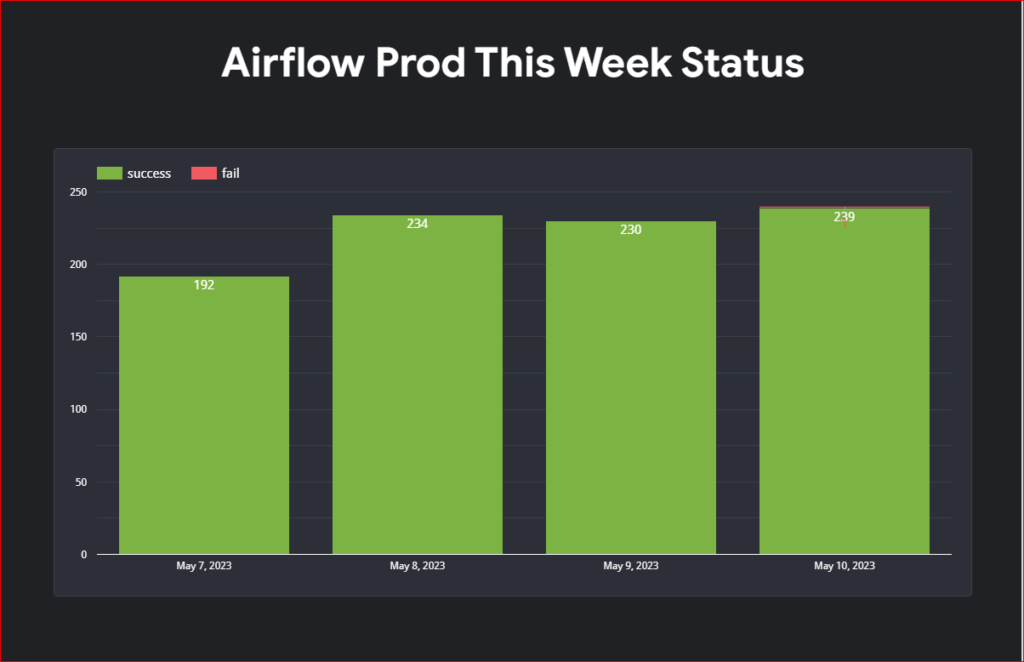
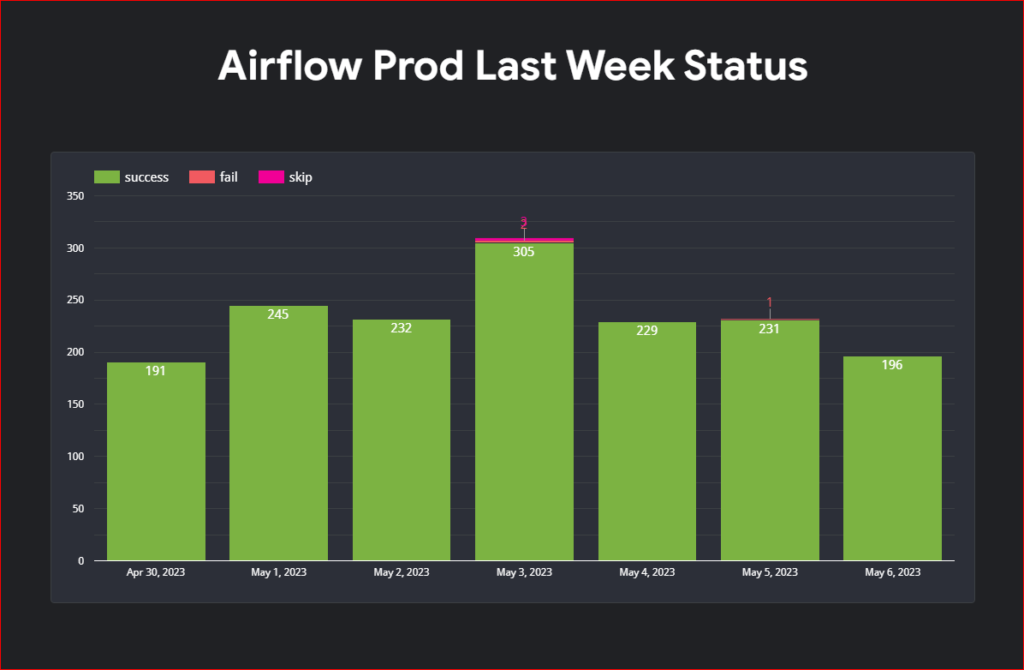
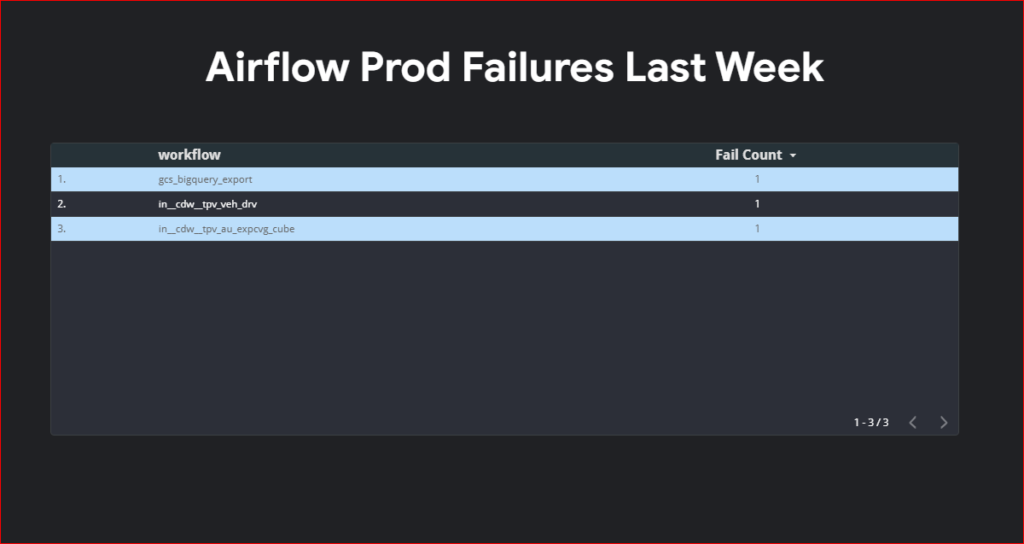
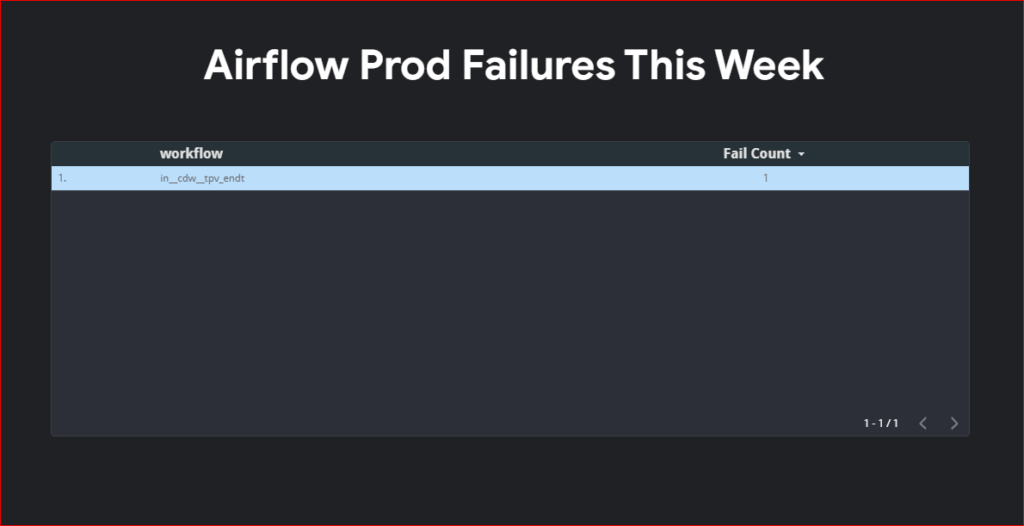
Unfortunately due to my organization policy I can’t share my looker studio dashboard outside my organization so you will have to create your own dashboard. I am uploading screenshot of my dashboard for your reference.

airflow daily status
showing airflow daily status.
airflow prod weekly status
Airflow Prod Weekly Filed DAG List
Airflow Prod DAG Failure List

Leave a Comment